source code:GitHub
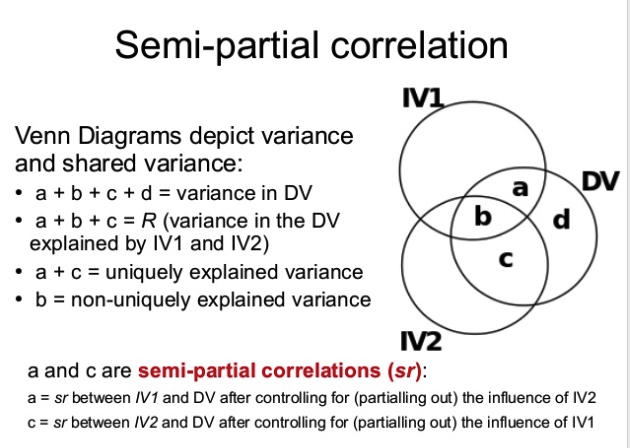
This webpage is visualizing how the varience of DV is explained by two IVs in multivariable linear regression. Equaltion of linear regression: Y = b1*X1 + b2*X2 + b0. The DV is Y and the two IVs are X1 and X2. Thoes concepts can be showed in venn diagrams as fig showed in bottom:
Traditional circle venn diagram may not show areas in proportion, thus, squares are used. The values below should have following relationships
0.0 ≤ Squared Partial Correlation(Y,X1) ≤ 1.0
0.0 ≤ Non-unique Explained Variance(Y,X1,X2) ≤ Squared Partial Correlation(Y,X1)
Squared Partial Correlation(Y,X1) ≤ Squared Partial Correlation(Y,X2) ≤ 1 - Squared Partial Correlation(Y,X1) + Non-unique Explained Variance(Y,X1,X2)
Note: Due to the geometry constrain, the generel Squared correlation(X1,X2) is not prepresented accuratly.
source: https://www.slideshare.net/jtneill/multiple-linear-regression-ii